
Infographic — a future tool for innovation development
Infographic combines data visualizations, illustrations, text, and images together into a format that:
tells a story,
provides key insights that weren’t visible before
or becomes an external artifact supporting decision-making.
In other words, infographics provide a format that utilizes engaging visuals that not only appeal to an audience hungry for information but also aid in the cognition and retention of highly complex information. This becomes highly important when developing large-scale innovations.
Why do our brains love infographics
People love using pictures to communicate and tell stories because it’s hardwired into the human brain.
Visual information gets to the brain 60 000 times faster than text, which leads to better and faster comprehension.
Our brain acquires information from the visual environment one to three times per second, which helps to focus better.
People can remember more than 2000 pictures with at least 90 % accuracy which is why infographics help with retention.
Business value
Usually, infographics are used for external communication — for branding, investor communication, public relations, or social media purposes.
Yet there’s untapped potential for internal communication use, especially in multistakeholder innovation teams, when you need to align the purpose, help simplify complex ideas, and embed understanding.
These are the key areas where infographics can support innovation development:
Decision-making — infographics speed up information consumption and understanding, resulting in quicker decisions.
Training — infographics make complex information easier to understand, helping newcomers with important data and processes.
Exchanging ideas — infographics can make it easier for innovations teams to communicate problems, ideas, concepts, and processes with each other, allowing more efficient dissemination of information and transfer of knowledge.
5 ways infographics can drive innovation development
Nr 1.
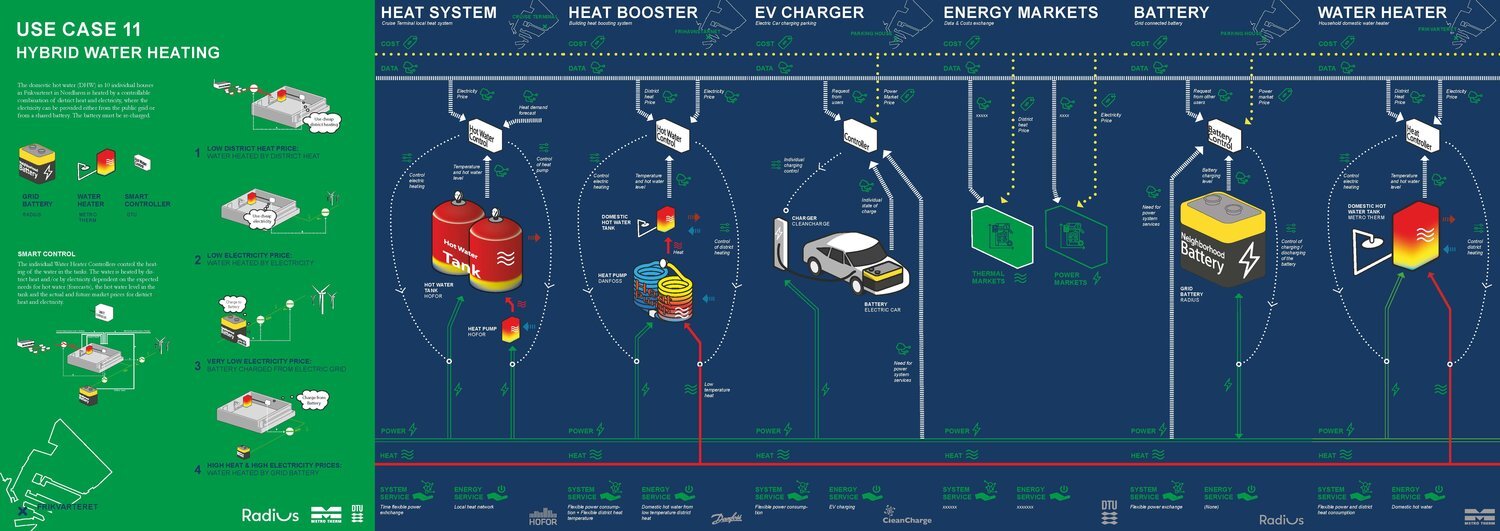
Project: New urban energy infrastructures
Form: Interactive infographic boards game
Client: EnergyLab Nordhavn
Impact:
1) Fine-tuned future vision of the energy system.
2) An interactive communications tool has quickly and effectively engaged anyone interested in the project.
3) Winning design solution at Danish Design Award 2019.
Nr 2.
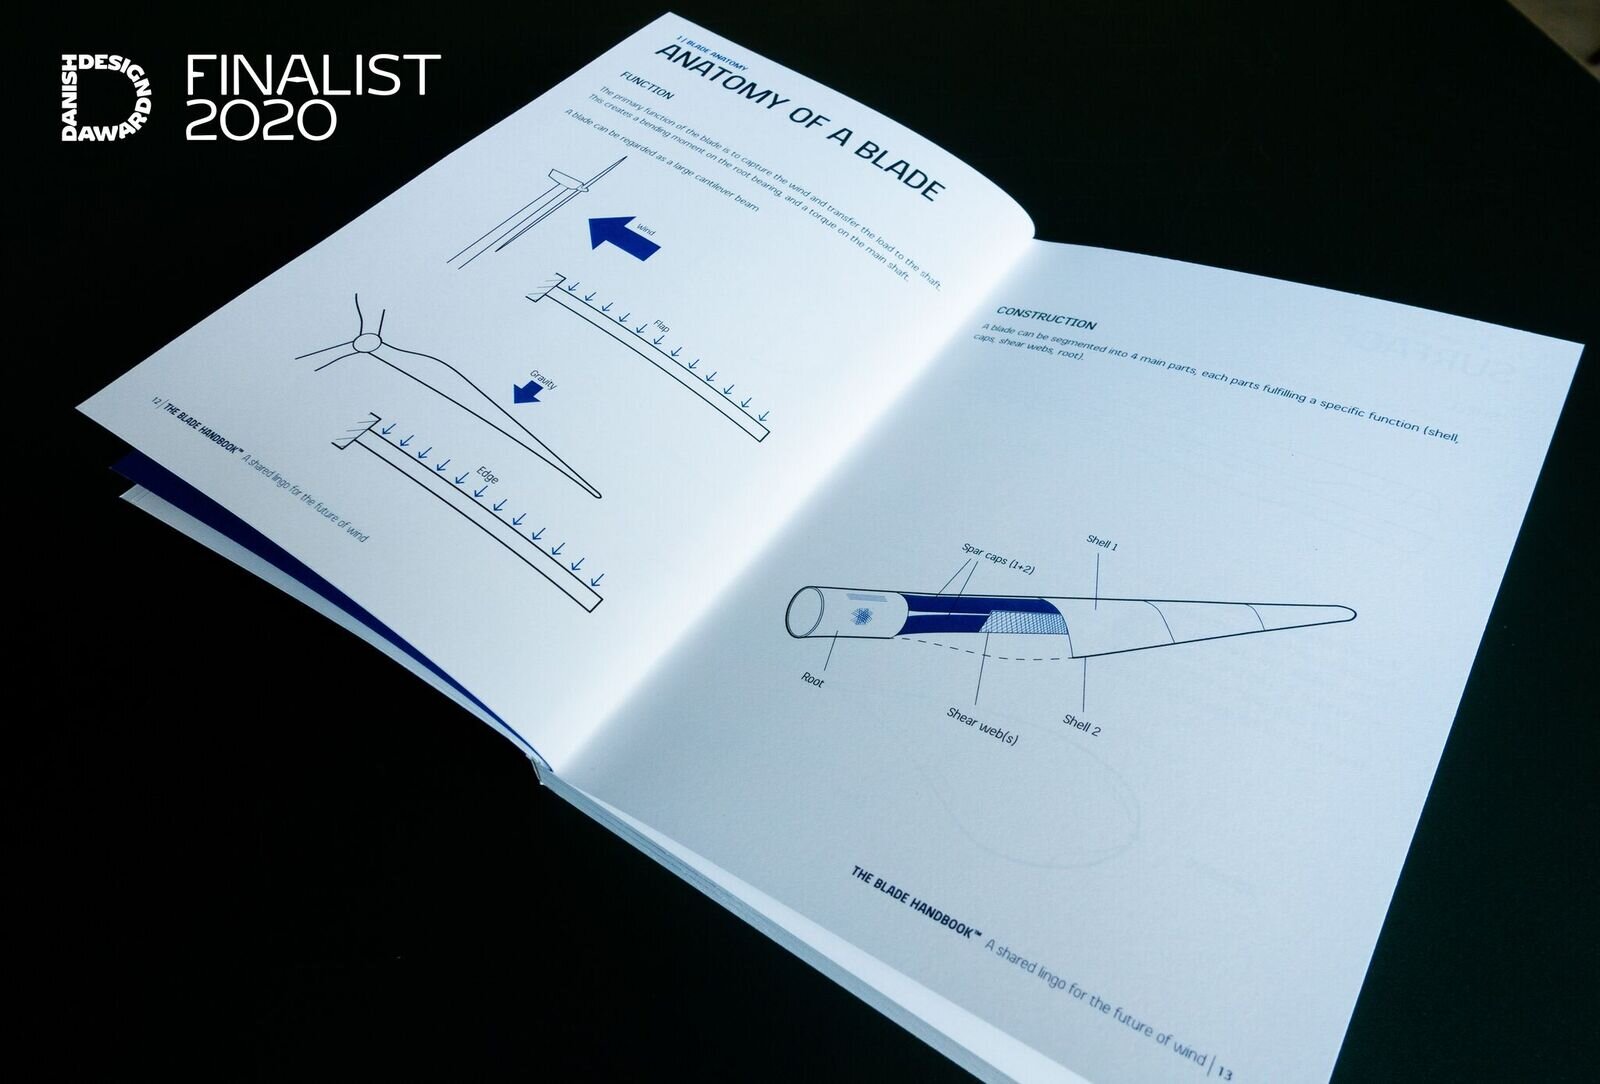
Project: The Blade Handbook
Form: The Handbook
Client: Cortir
Impact:
1) A co-created and shared language is being created about the wind turbine blades.
2) Helps to involve both experts and newcomers in the innovation process avoiding miscommunication and promoting better decision making.
3) Fosters open innovation in the design of wind turbine blades.
Nr 3.
Project: Amplifying thought leadership
Form: Onepager
Client: Wood Thilsted
Impact:
1) Clarifies the client’s value proposition.
2) Strengthens brand positioning.
3) Visually consumable information both for new clients as well as for the company’s employees.

Nr 4.
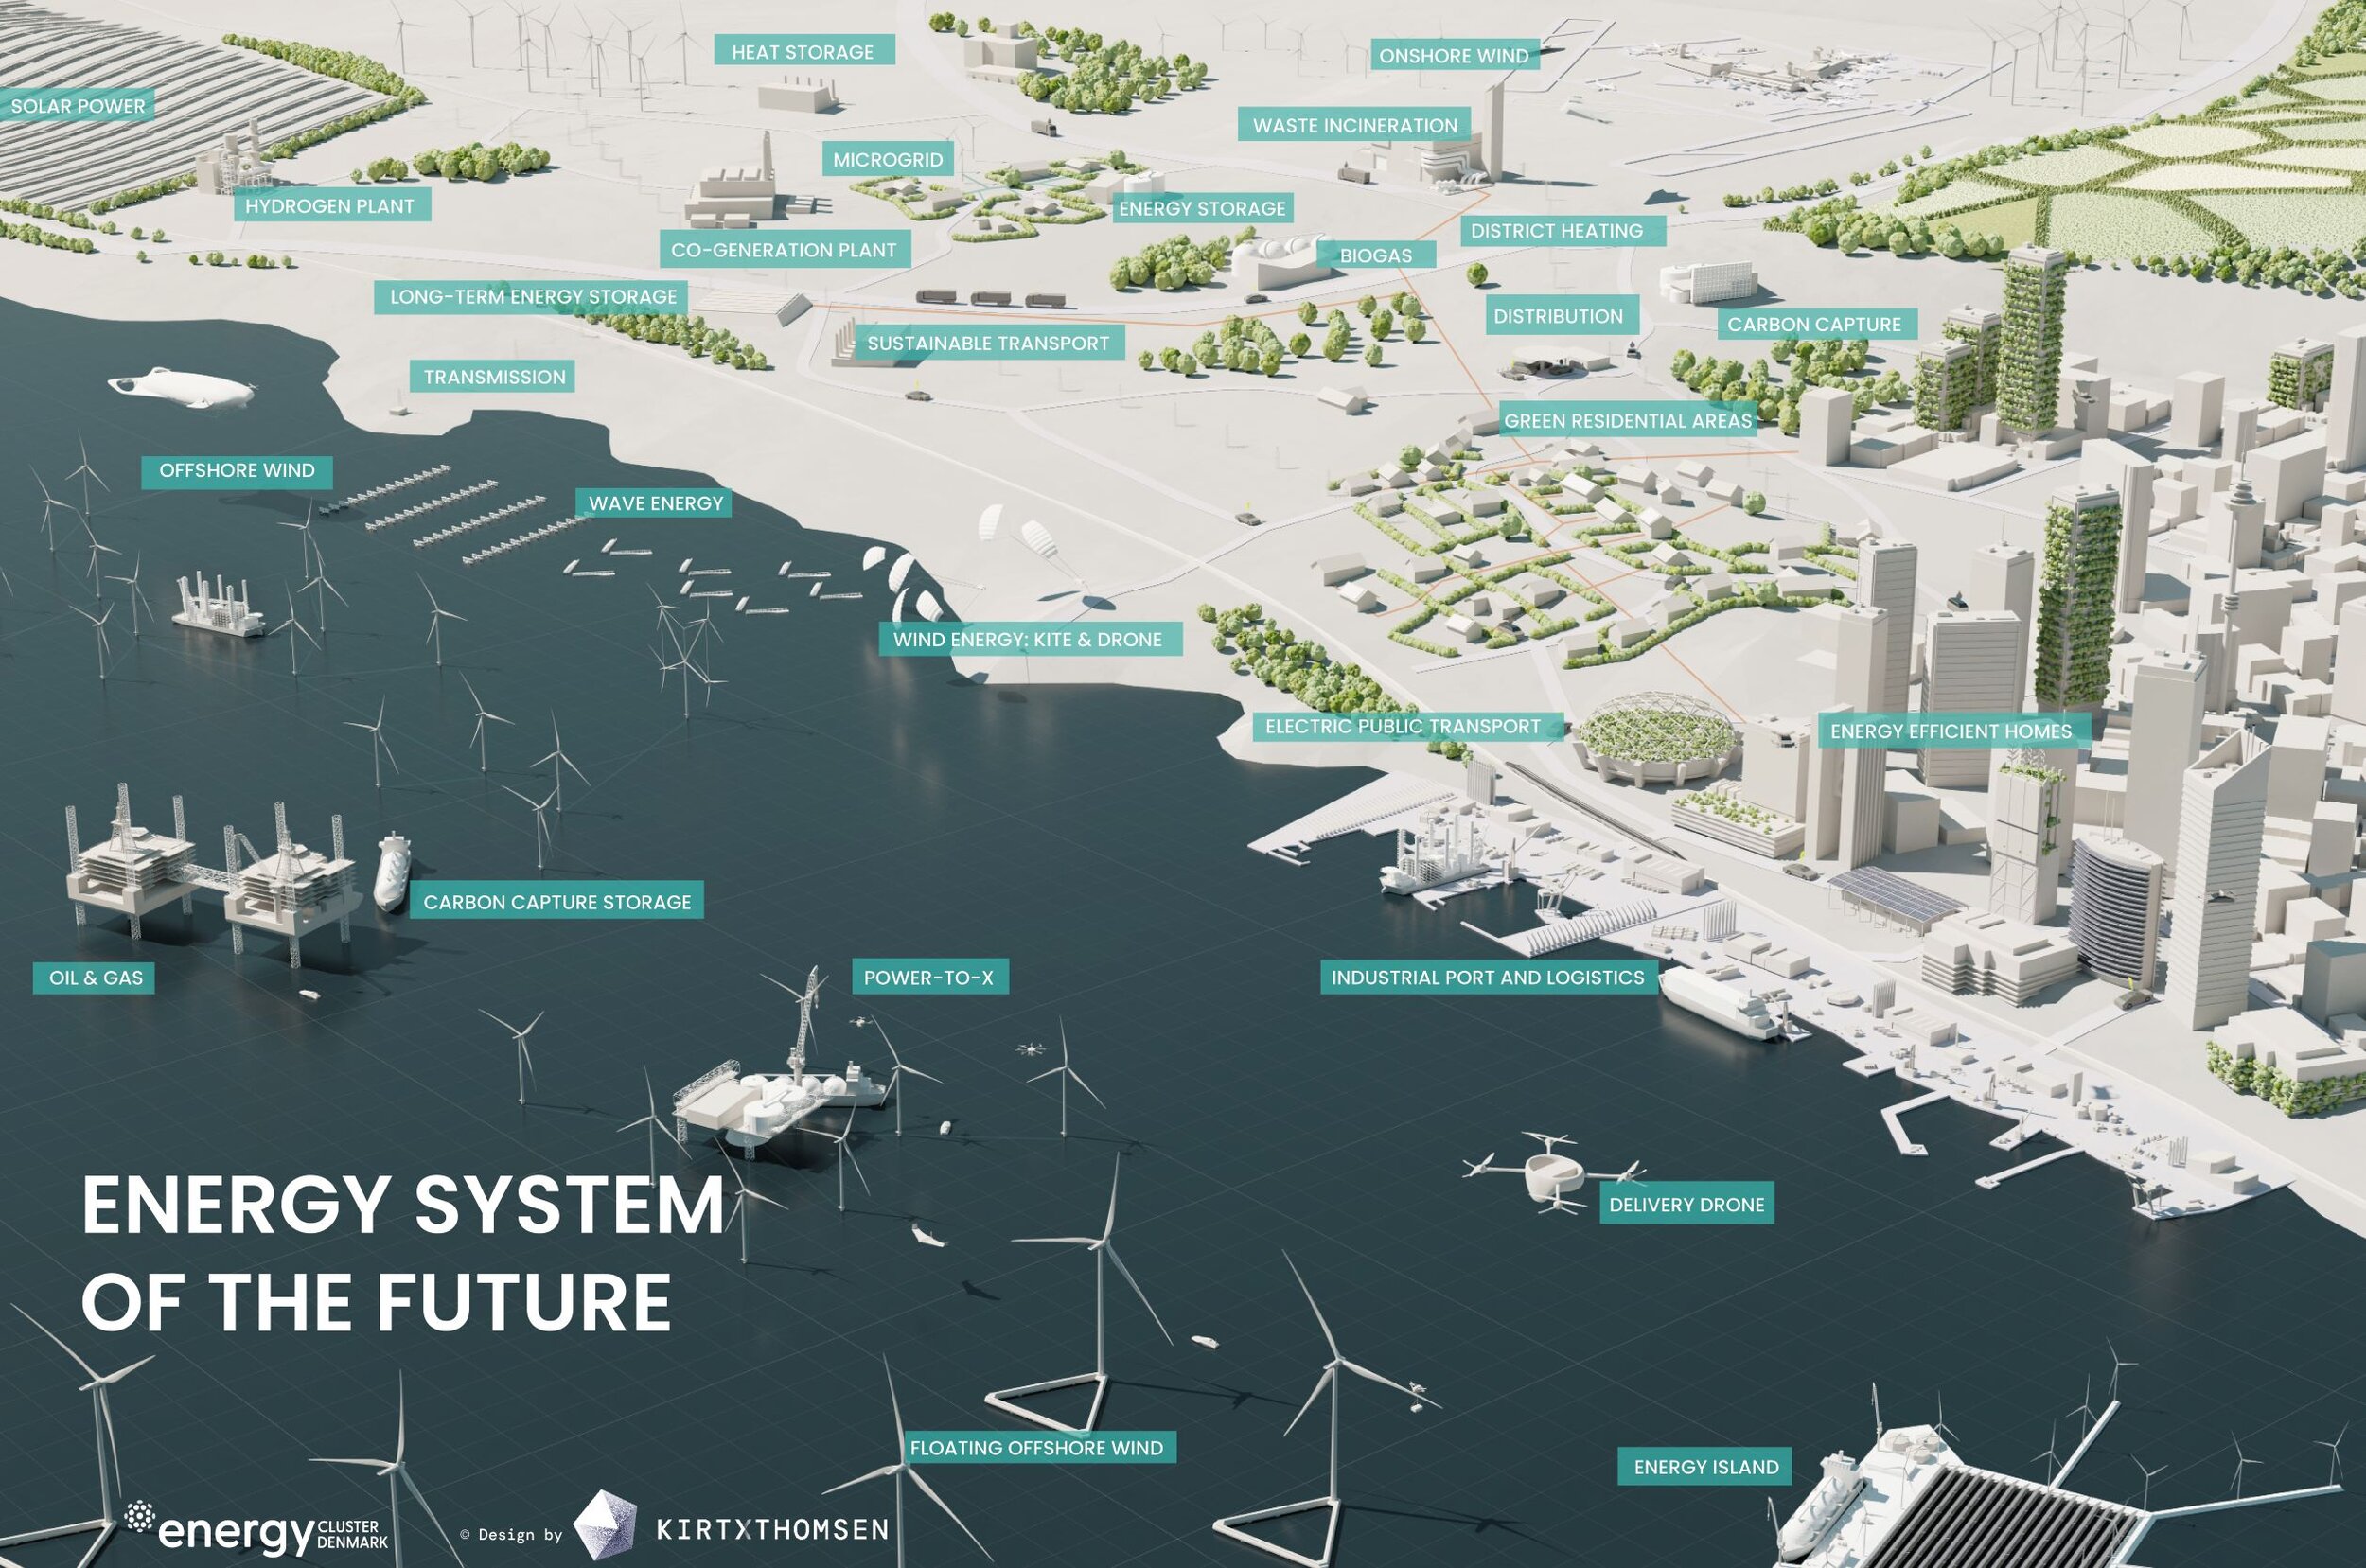
Project: Energy System of the Future
Form: Onepager
Client: Energy Cluster Denmark
Impact:
1) A bird’s eye overview in one place about future energy innovations.
2) Food for thought to discuss the inter-connectedness of innovations and possible new solutions.
3) Speaks to many audiences from versatile industries.
Nr 5.
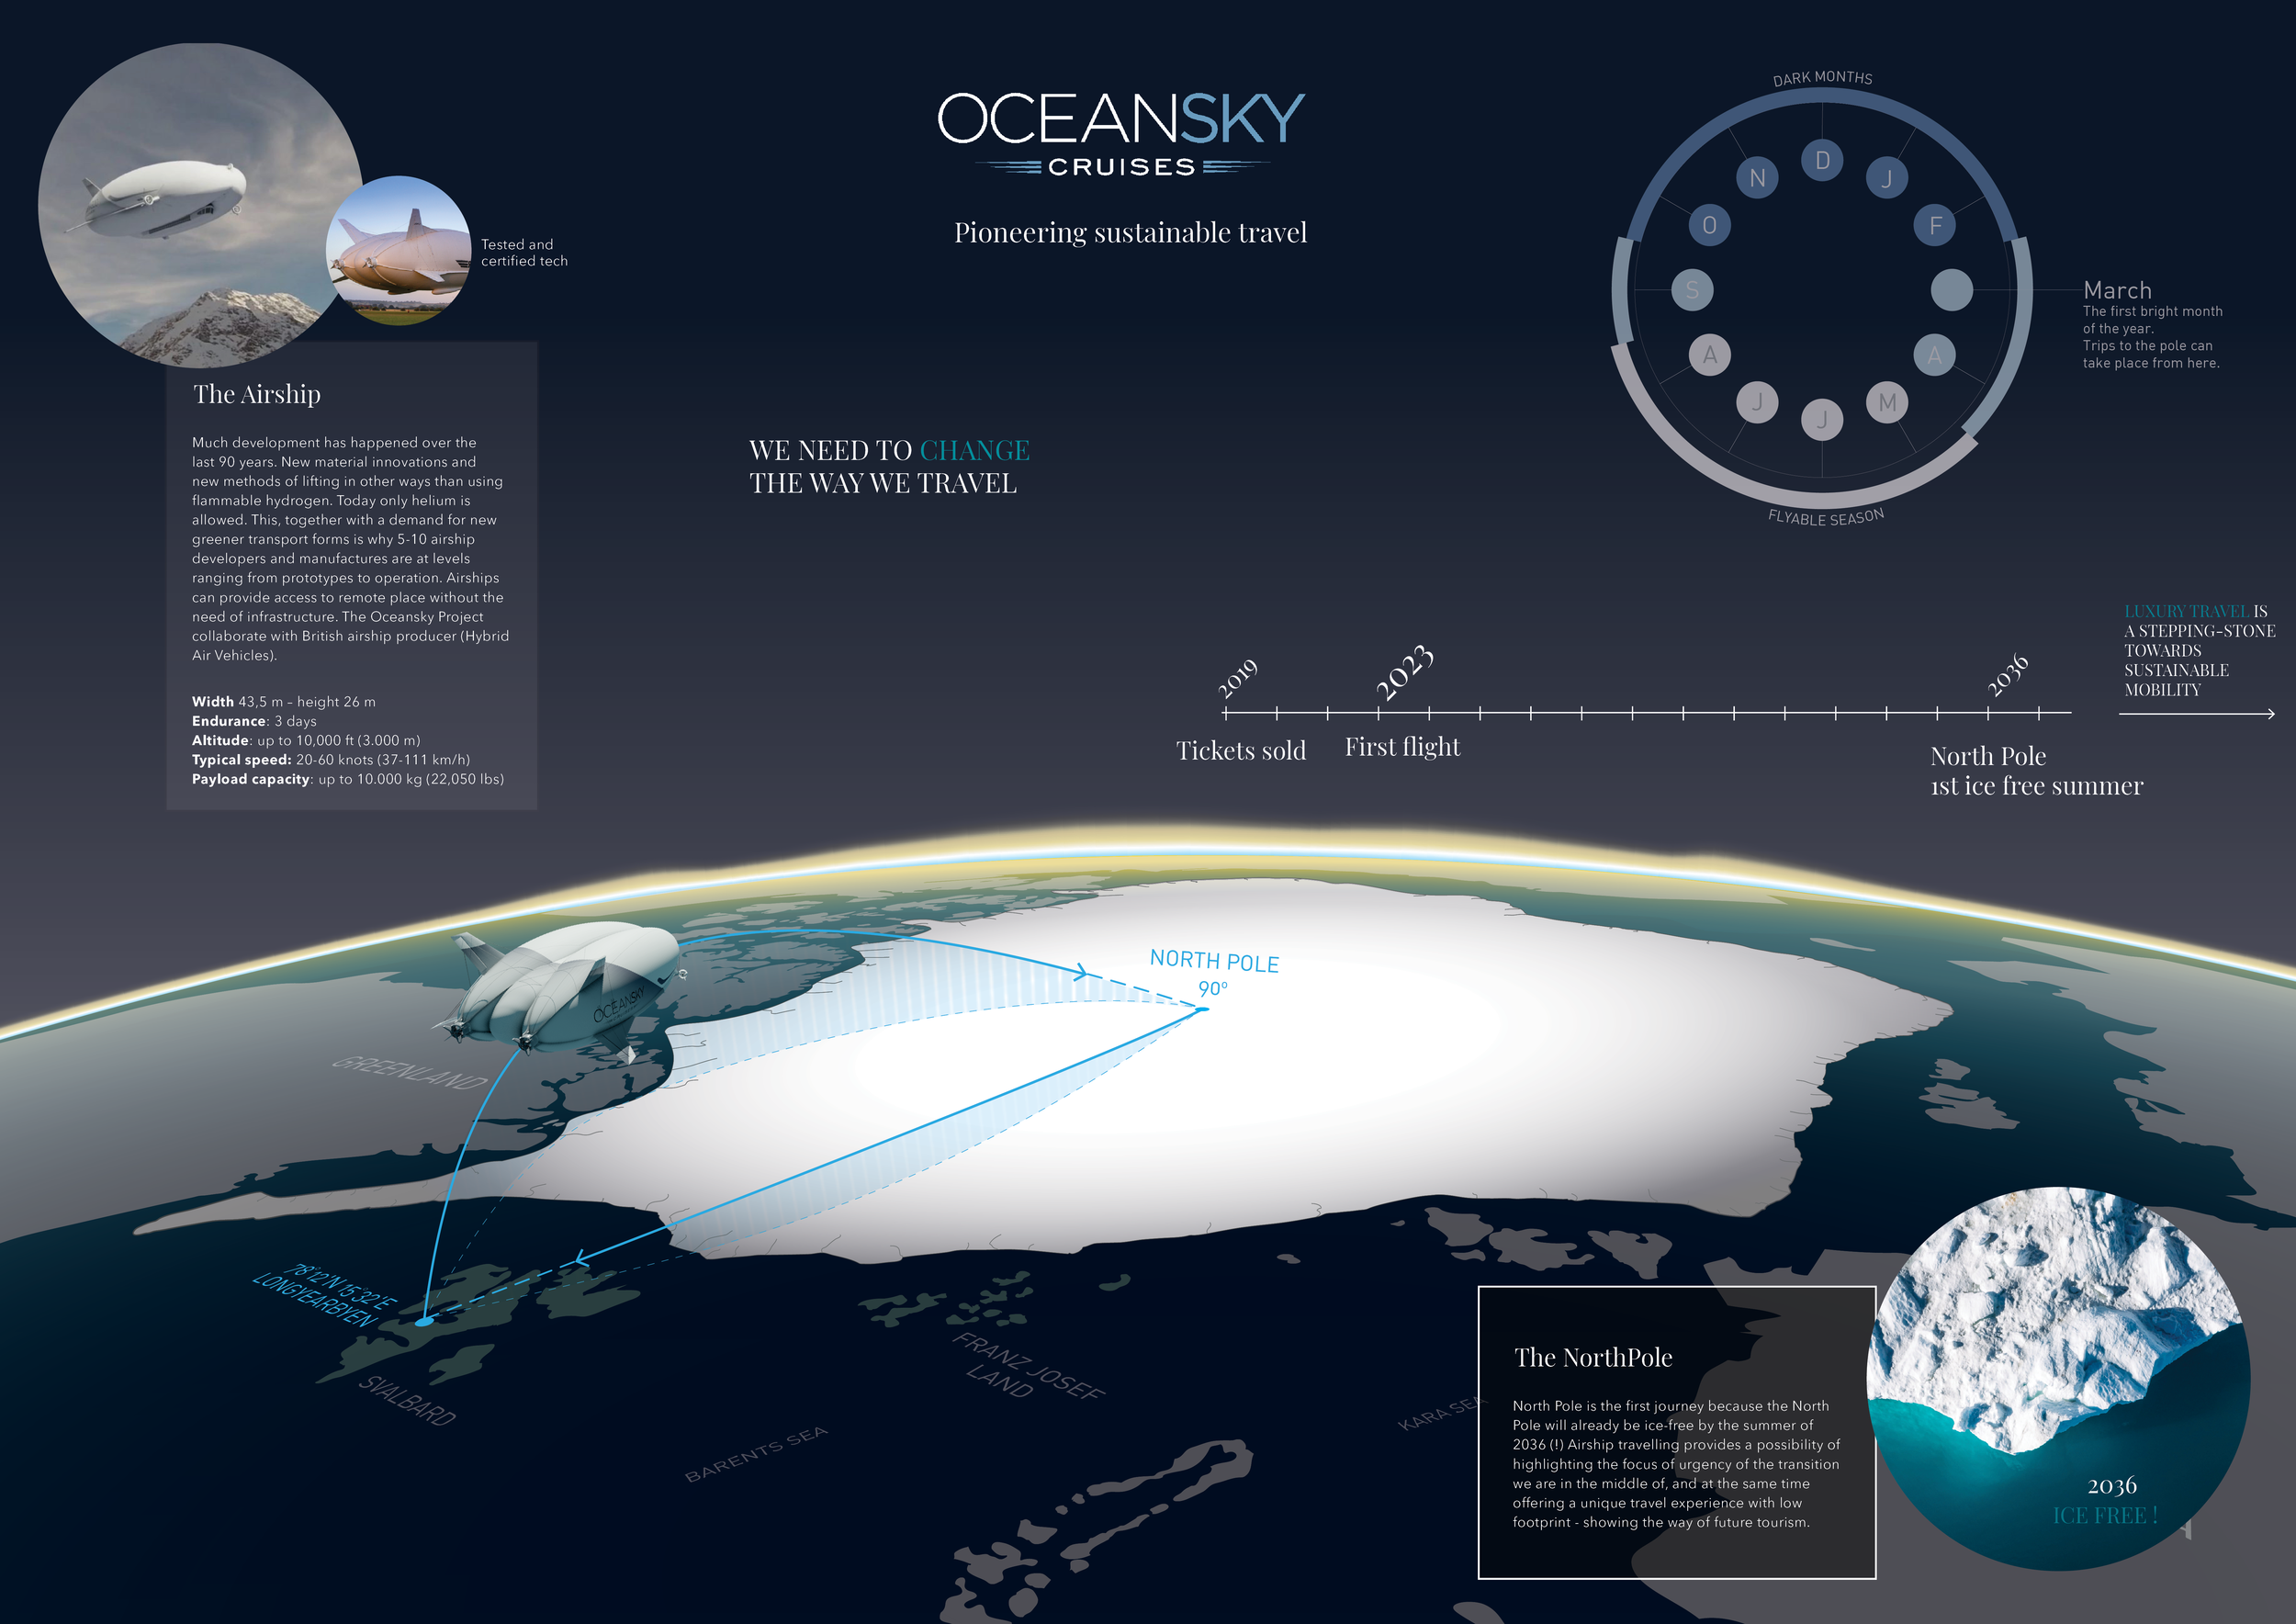
Project: Sustainable tourism experience
Form: Bunch of onepagers
Client: OceanSky Cruises
Impact:
1) Bridged the gap between futuristic client’s vision and reality.
2) Reduced time-to-market.
3) Nominated for the 77Core award.
Reach out to learn more how you can apply infographics for innovation development